

Car Performance Log app for iPhone and iPad
Developer: Kaup Shenoy Associates
First release : 22 Feb 2013
App size: 1016 Kb
Car Log is a uniquely designed, easy to use app to monitor energy efficiency and performance in personal cars. The app helps to keep track of all the operation and maintenance cost and generates performance indices that can be used for different economic analyses. Break-even is one such analysis which can be used for determining different options for replacing the existing car. A car may be uneconomical to operate under higher usage rate still be economical under low usage rate and vice verse.
Car Info:
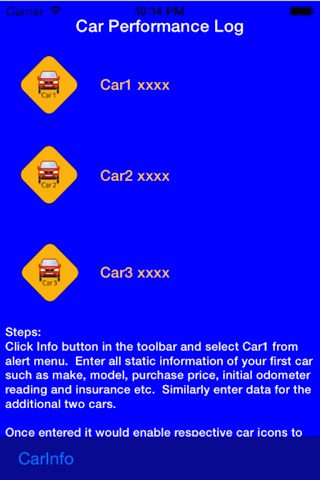
To begin with home screen is as shown below since there are no car info and log data on file. From this screen, users can quickly input up to three cars with all basic information on make, model , vehicle identification number, purchase cost, insurance and initial odometer reading. For convenience a list of major automakers around the world is provided in the picker in car info data input screen. One can specify the local currency and odometer reading in mile or Kilometer. These default values are chosen automatically in different log sheets and analysis report. After duly filling three car info, the home screen is shown below as an example.
Once car info is saved, one can quickly access individual screen for gas log, service log and log summary sheets from the pop up menu of respective car. Alert menu is displayed for every click or touch of the respective car icon in the home screen. A short description of each of this menu items with screen shots is given below.
Gas Log:
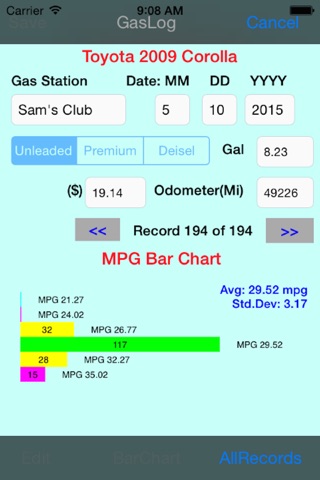
Users can enter the data on site as the fueling is done. It would take only a few seconds to enter the following data.
1.Type of fuel (unleaded/premium/Diesel)
2.Quantity filled in Gal/liters (It is important to fill until dispenser quits filling)
3.Cost (Amount paid in local currency)
4.Odometer reading (As you restart the engine).
Append this data in to your log sheet and it would instantly provide you the average mpg and other metrics and mpg bar chart as shown in the screen shot. One can also review all records in a separate scroll view.
Service Log:
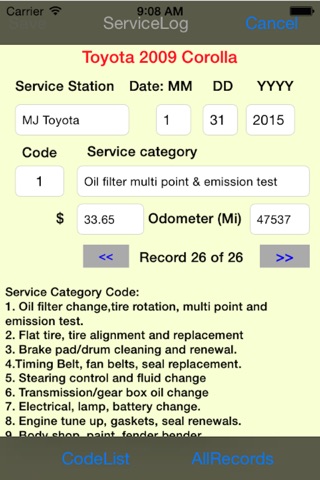
Record all periodic maintenance including oil/filter change as per the data sheet. Code number for major service categories has been provided for convenience that auto-fill the service category. One can easily enter all the data required using dealers invoice. One can also review all previous records separately in a scroll view.
Log Summary
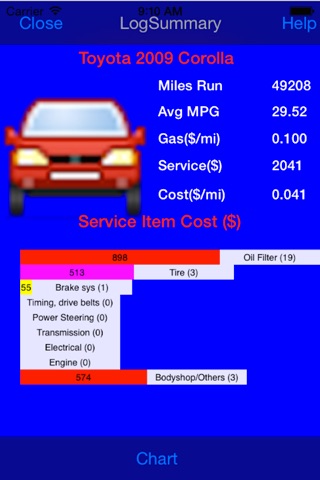
This section provides you with over all efficiency indices and associated costs with charts for a quick assessment. Service costs are summarized under three different bar charts as follows.
1. Item-wise Service Cost
2. Yearly Service Cost
3. Cumulative Service Cost
Screen shots are shown for a 2009 Toyota Corolla as an example for respective (3.5 inch and 4 inch) devices. Use the following link to review the additional screen shots provided on different car logs.
http://flowjoule.com/car_log.html
Help screen is provided for descriptions and notes on different terms used in the log summary. It also contains explanation on how to interpret mpg distribution and causes of variations, tips on break-even analysis for guidance.